
What Is Data Analytics? An In-Depth Look at a Crucial Business Tool
Data analytics. You've likely heard the term before in business circles. But what exactly does it mean? And why does it matter so much in today's data-driven world? Data analytics adoption is accelerating, yet recent research shows that 53% of companies struggle to build effective capabilities. This gap can severely restrict performance – a 2023 Forbes article found that Organizations that leverage customer behavioral insights and data outperform competitors by 85% in sales growth and more than 25% in gross margin.
Companies can use an analytics-driven approach to tap into rich data and make fact-based decisions. This has resulted in enhanced productivity, higher profitability, and better overall business performance.
This comprehensive guide will explain everything you need to know. You'll learn:
- The formal definition of data analytics and how it works
- The different types and categories of analytics
- Real-world examples and business use cases
- How companies of all sizes can benefit from leveraging analytics
- Key metrics to determine the ROI on analytics investments
- Step-by-step best practices to implement analytics in your organization
So, if you want to harness the power of data to drive smarter decisions and better business outcomes, read on.
The Rise of Data Analytics
The concept of basic analytics has existed for decades, but the field has grown enormously thanks to new technologies like machine learning and the explosion of available data. Whereas analytics was once limited to simple reporting of historical statistics, modern techniques can uncover complex predictive insights at an incredible scale.
In today's digital landscape, we create 2.5 quintillion bytes of data daily. Data analytics helps businesses derive value from this avalanche of information. By examining large datasets, organizations can identify patterns and trends that lead to better decisions, improved efficiency, higher conversion rates, and more targeted customer interactions - unlocking growth opportunities and providing a competitive edge.
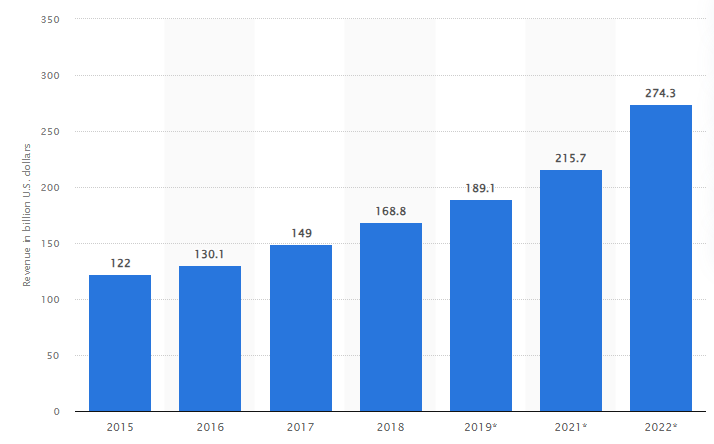
The analytics industry has ballooned in tandem with the growing data volumes. Revenues have doubled since 2015, topping $274 billion in 2022. And the field will continue expanding rapidly in the years ahead.
So, for any modern company, embracing analytics with the help of a data analytics services company is no longer an option. It's an absolute necessity to remain competitive. Companies that fail to leverage analytics risk ceding ground to more data-driven competitors who will relentlessly use those insights to optimize performance. Building strong analytics capabilities today is crucial to thriving in the current climate and preparing for disruptive shifts on the horizon – like IoT, spatial data, and quantum computing – that promise to revolutionize the field again shortly.
Defining Data Analytics: An Introduction
Data analytics refers to the science of examining raw data to uncover patterns, derive insights, and drive informed decision-making.
It incorporates both quantitative techniques (such as statistical modeling, metrics analysis, and predictive analytics) and qualitative techniques (such as data visualization, interviews, and focus groups) to transform volumes of data into meaningful insights. Quantitative analytics uncovers measurable trends and metrics, while qualitative techniques add crucial context regarding customer behavior patterns and preferences.
These data-driven insights empower business leaders across functions, including guiding marketing strategies and campaigns, forecasting operational capacity, optimizing supply chains, segmenting customers, and more. With analytics, decisions can be backed by evidence-based insights rather than gut instinct alone.
Data analytics powers innovation by revealing growth opportunities such as new market demand trends and customer needs. It enables efficiency gains by pinpointing wasteful processes across operations, manufacturing, and logistics that can then be targeted for improvement. For example, analytics might show retail outlets where inventory management can be enhanced to reduce spoilage.
In essence, analytics turns raw data into fuel for better decisions across strategy and operations - decisions backed by data that drive higher performance. Companies that tap into analytics will gain a competitive edge, while those that don't risk falling behind the curve operationally and strategically.
Types of Data Analytics
Not all analytics tools work the same way. Some examine historical data to explore what happened, while others apply algorithms to predict what will happen next.
The field can be broadly divided into three core types:
Descriptive Analytics
This entry-level category focuses on processing raw data to summarize what happened in the past. Techniques like data aggregation, mining, and reporting transform volumes of data into digestible metrics and trends.
Descriptive analytics establish an essential baseline of business performance. By condensing huge data sets into insightful snapshots, descriptive methods set the stage for more advanced analytics. Common descriptive questions include:
- How many sales did we close last quarter?
- Which products drive the most revenue?
- How website conversion rates have changed over time?
This rear-view look at business data sets the stage for deeper analysis.
Businesses usually utilize descriptive analytics for daily and monthly reporting. This approach provides a baseline understanding of performance before optimizing further.
Descriptive analytics also enables drill-down analysis into drivers behind aggregate metrics. Segmenting sales by region shows growth opportunities. Parsing web traffic by acquisition source guides marketing spend. The granular analysis uncovers hidden insights within top-level trends.
Diagnostic Analytics
The next analytical level aims to explain why past outcomes occurred as they did. The diagnostic analysis moves beyond surface results to study the underlying factors, root causes and variables that influence KPIs.
Examples of diagnostic insights include:
- Sales dropped last month due to low inventory levels of top-selling items
- Website visits from mobile fell after a recent OS update bug
- Higher sales conversion rates followed more targeted email campaigns
Understanding these causal mechanisms and relationships is crucial for learning from the past. Armed with diagnostic intelligence, leaders can fine-tune strategies earlier. Rapid diagnostics enable quicker fixes if mobile web traffic declines post-app update before losing more visitors.
Analysts employ statistical techniques like regression analysis (modeling relationships between variables) and multivariate testing (how changes to multiple variables impact outcomes) to reveal significant connections within data. Machine learning algorithms also help surface relevant patterns tied to key results.
Predictive Analytics
Armed with insights from descriptive and diagnostic analysis, analysts build models to forecast future outcomes. Using statistical algorithms and machine learning techniques, they can predict metrics like:
- Expected customer churn rates
- Projected sales for next quarter
- The likelihood a prospect will convert based on behaviors
Predictive analytics fuels data-driven planning and decision-making. It enables companies to prepare for challenges and opportunities before they occur.
According to Research Nester, the predictive analytics market size was $15 billion in 2023 and is expected to reach $219 billion by 2036, growing at a 25% CAGR from 2024 to 2036.
Predictive capabilities are only valuable when acted upon. Customer lifetime value models guide more targeted sales and marketing strategies. Churn predictions trigger timely account management outreach to retain valuable subscribers before it's too late. Prescriptive algorithms then recommend the best messaging and offers tailored to individual account needs.
As predictive models ingest more data, accuracy and business value increase exponentially. The system continuously learns from outcomes to sharpen future forecasts over time. But without clear processes for applying predictive insights, companies severely limit their ROI.
Advanced Applications of Predictive Analytics
Cutting-edge predictive techniques enable even more ambitious applications.
- Algorithmic Forecasting: Predictive models can forecast sales, demand, and other metrics with greater accuracy than manual methods. Statistics-driven systems account for many subtle variables simultaneously. They quickly incorporate new signals and outcomes to continuously get smarter.
- Preventative Maintenance: Industrial sensors paired with predictive algorithms forecast equipment failures and required repairs. Through proactive maintenance, manufacturers can minimize downtime and boost yield.
- Dynamic Pricing: Pricing optimization algorithms react in real-time based on predicted supply, demand, competitor actions, and other factors. Models prescribe pricing to maximize revenue and margin opportunity.
- Algorithmic Recommendations: Platforms like Netflix and Amazon have mastered predictive recommendations. Models suggest products and content matching user preferences based on historical behaviors and similar profiles. The system continually A/B tests new algorithms to drive higher engagement.
- Fraud Detection: Card issuers employ predictive models that recognize patterns typical of fraudulent transactions. Accuracy rates exceed 95% in flagging illegitimate charges for review before approval.
- Disease Outbreak Tracking: Analysts link place, queries, hospitalization, and other factors to understand virus transmission. The outcomes are used to develop strategies for managing public health threats and distributing resources.
The applications are categorized according to the industry in which they are used. Real-time self-learning predictive engines are now possible, which allows for more complex applications. The models offer the advantages of speed, increased sophistication, and standardization surpassing human analysts.
In conclusion, predictive analytics has vast potential. It gives a competitive advantage to first movers who are willing to take risks.
Categories of Analytics
Industry analysts also subdivide the field into three broader categories based on the type of data involved:
1. Quantitative Analytics
This approach only concerns quantitative information, such as sales, traffic counts, cost per sale, feedback, etc.
Quantitative techniques include statistical analysis, predictive modeling, and optimization techniques. They produce practical ROI-oriented key performance indicators that insights teams can implement.
2. Qualitative Analytics
The raw inputs include non-numerical data such as customer satisfaction scores, reviews and feedback, social media conversations, email inquiries, and other text sources.
Qualitative techniques analyze this data for patterns to uncover issues, emerging trends, changes in sentiment over time, topic prevalence, and more. The findings reveal how customers feel about a company's brand, products, services, and reputation.
3. Diagnostic Analytics
This branch combines quantitative and qualitative data to understand what is happening and why. Techniques link cause and effect using cross-dataset correlation analysis.
For example, diagnostic analytics may connect a drop in NPS scores with recent supply chain issues and product defects. This demonstrates how multiple variables influence complex business outcomes.
In practice, most analytics initiatives tap into all three categories to drive deeper insights. However, the split highlights how the field has evolved to handle diverse data types and questions.
The 11 Most Important Benefits of Data Analytics
Now that you understand the definition and key types of analytics, let's explore why it matters so much. Adopting analytics delivers game-changing benefits across all business areas, from cost savings and efficiency gains to expanded revenue opportunities. Analytics unlocks immense upside for organizations, large and small.
While the focus here is on the positive impacts, it's important to note analytics initiatives also pose challenges around data quality, adoption, costs and more. However, most obstacles can be overcome with strategic planning, change management and patience as analytic capabilities mature.
Here are 11 compelling benefits your company can realize:
Short-Term Benefits
1. Increased Operational Efficiency
Analytics drives significant near-term efficiency gains by exposing waste and highlighting optimization opportunities. Companies like UPS have used analytics to map optimal delivery routes, reducing mileage and fuel costs by millions annually. Further efficiencies can be achieved by analyzing supply chain data to minimize excess inventory carrying costs.
2. Enhanced Customer Targeting
Granular customer analytics guides more personalized and relevant messaging across channels. Segmentation and predictive models boost conversion rates for acquisition and retention campaigns in the short term. Top UK retailer Tesco leverages analytics to craft tailored promotions to different customer segments, leading to higher response rates.
3. Reduced Churn & Increased Lifetime Value
Diagnosing drivers of churn enables proactive retention programs addressing at-risk accounts. Companies can identify customers showing precursors of churn, like reduced engagement and prompt them with incentives to stay. Similarly, analytics informs cross-sell and upsell initiatives to nurture higher-value relationships. Spotify's analytics help identify users at risk of canceling subscriptions and prompt them with custom incentives to stay.
Long-Term Benefits
4. More Accurate Financial Forecasting
Predictive modeling and AI/machine learning help teams forecast sales, growth metrics and other financial KPIs more accurately over multi-year horizons. Statistical algorithms can process many data signals to detect lucrative new market opportunities faster than human analysis alone. For example, Intuit uses automated deep learning algorithms to predict revenue accurately.
5. Improved Product Development
Analytics identifies rising customer requirements, pain points with current products, and market gaps to guide engineering investments. This intelligence informs roadmaps and new product launches that drive future revenue. Disney employs analytics to determine what types of movies and content to produce based on historical data of successful titles. Startups also use analytics to validate product-market fit before scaling up.
6. Smarter Resource Allocation
Analytics determines high-performing business units, campaigns, products, channels and assets to double down on. Teams can shift budgets away from poor performers informed by hard data for sustained growth. Media companies use analytics to shift budgets to social platforms and ad types yielding the highest conversions.
7. Reduced Risk Exposure
Data modeling helps identify signals preceding adverse events like transaction fraud, technical failures, brand crises, or compliance breaches. By analyzing past incidents, models can detect similar warning signs earlier. Early detection gives teams more time to implement preventative measures that minimize long-term risk. Banks employ analytics on customer transactions to identify potential fraud faster than manual auditing.
Strategic Impacts
8. Increased Agility & Innovation
Rapid analysis of shifting market dynamics, emerging technologies, competitor moves, and customer needs accelerates strategic pivots over months and years. Analytics-savvy firms adapt faster to sustain competitive advantage. For example, analytics-enabled Netflix to pivot from DVD rentals to streaming content when it recognized changing consumer viewing habits years ahead of its peers. Startups rely on analytics to iteratively adapt products to increase stickiness.
9. Improved Decision Making
With analytics, long-term choices at all levels rely more on evidence-based insights than assumptions and gut instinct. Models can synthesize intelligence from huge volumes of data that humans cannot process alone. All levels of management can make smarter calls empowered by analytics vs. simply experience. Over time, ingraining data-driven decisions yields compounding gains as the sum of small smart choices outweighs a few big but misguided bets.
10. Stronger Compliance Posture
Analytics aids audit preparation, financial reporting, policy documentation, and other compliance processes. By continually monitoring for red flags, issues can be addressed proactively, reducing penalties, lawsuits, and reputational damage from violations. Analytics also links compliance to performance, allowing teams to optimize processes without sacrificing quality. For example, banks use analytics to detect suspicious transactions and remain compliant without adding excessive delays.
11. Increased Innovation Culture
An analytics-driven culture inherently fosters more innovation. Companies embed agility by continually analyzing market changes and testing new ideas based on data. Over time, the intuitions and assumptions that often hinder legacy firms are replaced by an openness to explore diverse data-backed perspectives. With analytics ingrained, employees proactively seek out analytics to validate hypotheses before moving forward, creating an evidence-based company. Startups embracing analytics typically possess more innovative cultures with better ideas rising to the top.
In aggregate, these advantages create a formidable competitive edge for analytics-focused organizations. The approach pays dividends across all business core facets for immediate and long-ranging growth. Investing in analytics generates both quick returns and sustained upside over the long term.
Real-World Applications and Use Cases
Now that you grasp the incredible value proposition of analytics, let's showcase how real companies are using it to achieve spectacular results across various functions.
Marketing Analytics Use Cases
- A/B testing campaign messaging and web pages to determine optimal content and formats
- Attribution modeling to quantify the ROI of various lead generation channels
- Geo-based analysis guiding field marketing and billboard ad placements
- Monitoring campaign analytics dashboards in real-time to quickly respond to performance shifts
- Sentiment analysis to track brand perception and guide PR initiatives
- Predictive lead scoring to qualify inbound prospects for sales follow-up
Emerging marketing analytics trends involve leveraging AI and machine learning to hyper-personalize messaging, offers, and customer experiences based on individual behaviors and attributes. Marketing teams also increasingly utilize real-time dashboards and automation in campaign management processes to enable rapid decision-making and optimization.
For example, Netflix's recommendation engine is crucial for user engagement, with estimates suggesting that it influences 75-80% of what users watch. This high level of personalization is achieved through complex predictive analytics algorithms that analyze user behavior and preferences.
Sales Analytics Use Cases
- Statistical forecasting of pipeline conversions to inform revenue projections
- Diagnosing win/loss ratios by product line, customer segment, geographic market, etc.
- Mapping customer analytics profiles to ideal buyer personas to target high-probability accounts
- Tracking sales activities and pipeline metrics to optimize processes
- Automating notifications on significant account developments for account managers
- Building predictive models to estimate customer lifetime value and guide account prioritization
Organizations are exploiting technologies like virtual assistants and predictive analytics to boost sales performance and recommend relevant cross-sell/upsell opportunities in real-time during customer interactions. Prescriptive analytics models can also automatically trigger interventions for high-risk accounts.
The sales and marketing relationship is growing increasingly integrated, with shared customer analytics powering account-based marketing initiatives, targeted advertising, and coordinated lead nurturing campaigns. Integrated profiles centrally tracking prospect engagement across sales and marketing provide unprecedented visibility into the buyer journey.
Finance Analytics Use Cases
- Statistical modeling for accurate budget forecasting and risk analysis
- Optimizing staffing costs and productivity by analyzing trends and operational data
- Monitoring for fraudulent financial activity using pattern recognition and anomaly detection algorithms
- Correlating finance and operations data to model working capital requirements as the business scales
- Simulating different growth trajectories and expansion scenarios to stress test financial plans
- Automating financial reporting by pulling data directly from analytical database layers
Supply Chain Analytics Use Cases
- Demand forecasting based on historical orders, sales projections, and external factors like seasonality
- Identifying manufacturing waste and process bottlenecks via sensor monitoring and analytical dashboards
- Optimizing distribution network design and inventory placement using operations research models
- Allocating safety stock levels and setting reorder points based on product demand volatility
- Dynamic price optimization algorithms reacting to competitor pricing and inventory levels
- Prescriptive analytics guiding procurement optimization, freight consolidation, and other tactical decisions
Amazon uses advanced mathematical optimization and machine learning to decide what products to buy, how much to buy, where to place them, and more. This helps Amazon scale its worldwide network and meet customer expectations.
Amazon's Customer Order and Network Density Optimizer (Condor) algorithm assesses customer orders before they leave a fulfillment center to identify the most effective shipping options. In tests, it reduced required routing resources by about 0.5%.
Healthcare Analytics Use Cases
- Identifying patient risk factors for disease complications using predictive models, enabling targeted early interventions
- Uncovering bottlenecks slowing patient discharge times with process analytics to increase bed availability
- Leveraging geospatial analytics to position ambulances to optimize emergency response times strategically
- Detecting fraudulent insurance claims by analyzing patterns across billing data
- Forecasting pharmaceutical demand based on demographics, disease rates, and seasonal factors to optimize inventory
Cleveland Clinic uses prescriptive analytics to improve cost and quality of care. Models guide optimal treatment paths based on symptoms, risk factors, costs, and probabilities of complications. This reduced readmissions by over 15%.
Retail Analytics Use Cases
- Optimizing product assortment and shelf space allocation for each store based on local customer demand
- Identifying high-value customer segments through cluster analysis for tailored promotions
- Forecasting workforce requirements during peak trading hours based on store traffic patterns
- Monitoring real-time POS and inventory data to personalize digital signage content dynamically
- Analyzing basket data to provide product recommendations that increase order values
Home Depot optimized staff scheduling across stores by forecasting real-time foot traffic patterns based on weather data, inventory levels, and region-specific demand shifts. This allowed more efficient capacity allocation.
Manufacturing Analytics Use Cases
- Predictive maintenance applications leveraging sensor data to minimize unscheduled downtime
- Real-time supply chain analytics to adjust production schedules when upstream component deliveries are delayed
- Uncovering root causes of quality deviations using process control charts and capability analysis
- Modeling different machine maintenance policies to find the optimal tradeoff between cost and reliability
- Simulating production scenarios to evaluate capacity constraints and capital expansion decisions
Boeing employs predictive maintenance analytics on their aircraft, using IoT sensor data to optimize maintenance cycles for dynamic airline usage. This has reduced maintenance expenses by over a third.
The possibilities are endless. And the above just scratches the surface of potential applications. The common thread is letting data, rather than gut feel, drive critical choices across every business function.
Key Steps to Implement Analytics
Hopefully, you're now keen to tap into the power of analytics within your organization. So, what are the key steps to get started?
First, align executive leadership around the analytics vision and strategy. Frame objectives around specific business goals like improving customer retention X% or reducing operational costs Y% through data-driven optimization.
Next, build out a data analytics environment. Key components include:
- Central data warehouse(s) for storage and processing
- Analysis software like SQL, Python, R, and data visualization tools
- Cloud platforms like Snowflake, Databricks, AWS, and GCP provide additional scale and capabilities.
- Containerization with Kubernetes (packaging software for easier deployment)
- Orchestration layer to schedule ETL (data extraction, transformation, loading) pipelines, workflows, models, and monitoring
- Dashboards, alerts, and reports to deliver insights to business teams
Take Walmart, for example, which built a strong data analytics foundation, including cloud data platforms. By optimizing supply chain logistics through analytics, they reduced shipping costs by 15% over two years. Furthermore, Walmart has lowered the cost of making last-mile deliveries from its stores to customers' homes by about 20% over the past year.
With the foundation in place, identify high-impact pilot projects. Good starting points address tangible pain points across sales, marketing, finance, supply chain, etc.
As the pilot results materialize, use demonstrated quick wins to build momentum. Gradually scale analytics through more functions and teams via an iterative rollout roadmap.
At the same time, the focus should be on cultivating in-house analytics talent and data literacy. Training programs, data camps, guest speakers, and other initiatives create a thriving analytics culture.
Follow these steps while maintaining unwavering executive support. Approach analytics as a long-term business transformation rather than a one-off project. With a sustained commitment to developing capabilities, your analytics investments will repay themselves many times over.
Measuring the ROI of Analytics Initiatives
As with any major business initiative, you'll want to gauge the return on your analytics investments. To calculate the ROI, establish a performance baseline across key metrics. Then, improvements on those metrics will be tracked over time after implementing analytics to quantify the tangible benefits and returns.
The ROI formula is:
(Gain from Investment - Cost of Investment) / Cost of Investment
So if analytics software and talent cost 100,000 in year one and lead to 300,000 in increased profits, the ROI is (300,000−100,000) / $100,000 = 200%
Common ROI Metrics Across Industries:
- Percentage point increases in conversion rates for sales prospects, marketing leads, etc.
- Percentage point gains in customer retention or renewal rates
- Reductions in customer acquisition costs
- Decreases in operational and inventory costs
- More accurate financial forecasting (based on actual vs projected budget variance)
- Faster resolution times for customer issues and outages
Examples by Industry:
Manufacturing
- Reduced machine downtime leading to a 5% increase in units produced
- Lower inventory costs from better demand forecasting
Retail
15% increase in cross-sell/upsell revenue through product recommendations
20% better store labor efficiency from staffing level optimization
Healthcare
- Shorter billing cycles resulting in 10% faster payments
- Improved patient satisfaction scores, boosting referrals
The metrics and examples above demonstrate industry-specific ties between analytics programs and financial returns. The results often speak for themselves – recent data shows that data-driven businesses are 23 times more likely to outperform their competitors in customer acquisition, approximately 19 times more likely to remain profitable, and nearly seven times more likely to retain customers.
Proven solutions typically pay for themselves within the first year. And the benefits compound each year as capabilities mature. Even modest gains of a few percentage points translate to immense earnings upside at scale. The long-term gains can transform entire businesses across sectors.
Sharing the Analytics Vision
Now that you have a compelling case for analytics, it's time to get leadership on board.
Schedule an executive presentation covering:
- Current business challenges analytics can address
- Proven high-ROI use cases matching company priorities
- Estimated impacts based on peer performance benchmarks
- Overview of platform options and budget requirements
- Proposed step-by-step rollout plan and timeline
Emphasize how analytics aligns with larger strategic goals around growth, cost management, risk reduction, and agility.
Leave ample time for Q&A so you can clarify concepts and address concerns. Aim for enthusiastic buy-in across leadership to smooth the path for subsequent planning and approvals.
Vetting Analytics Platform Options
With executive sponsorship secured, the next task involves selecting enabling technologies. The platform choices made now will determine what analytics capabilities get unlocked for years to come.
When evaluating options, it's important to understand the strengths and limitations of each type of platform:
- Cloud data warehouses like Snowflake and BigQuery focus on scalable storage and processing for structured data. They allow for SQL-based analysis. Redshift offers similar capabilities but is proprietary to AWS.
- Business intelligence suites like Tableau, Looker and Power BI specialize in interactive reporting and visualizations for business users. Tableau leads in advanced analytics, while Power BI excels at integration with Microsoft products.
- Notebook environments like Databricks and Jupyter provide code-based environments for ad hoc exploration and modeling using languages like Python and R. Databricks adds Spark optimization for big data use cases.
- End-to-end enterprise analytics hubs like SAS, Oracle and Teradata incorporate data management, analysis, reporting and even machine learning in one system. They can be powerful but expensive and complex.
- Open-source tools like Apache Spark for large-scale processing, Airflow for workflow automation and dbt for data transformation appeal to organizations with advanced IT skills. The tools are free but require more effort to deploy and maintain.
- Fully managed solutions like AWS QuickSight, Microsoft Azure Analytics and Google Looker offer pre-built analytics capabilities with minimal IT overhead. However, compared to commercial alternatives, advanced options may be lacking.
Data governance is another critical consideration. Even the most advanced platforms will fail organizations if the underlying data lacks accuracy, security and compliance with regulations. Prioritizing governance, metadata management, and quality assurance will ensure success, especially as analytics scale to enterprise-wide capabilities.
Additionally, it's important to consider how qualitative data fits into the broader analytics strategy. For a detailed comparison of qualitative data analysis software, refer to this article to understand key factors to consider in your decision-making process.
The best platform also depends greatly on business size and industry:
- Enterprises: End-to-end hubs like SAS or Oracle combine governance, storage, processing and analysis for systems managing petabytes of data with thousands of users.
- Mid-size businesses: Integrated cloud solutions like Snowflake and Tableau balance automation and customization for growing analytics needs.
- Small business: Pre-built SaaS apps like QuickSight and Looker minimize IT needs with easy-to-use functionality.
- Healthcare: Prioritize security and compliance capabilities to manage sensitive patient health data.
- Retail: Seek real-time stream processing and location-based analytics to track customer behavior.
The goal is flexible foundations that allow for quick wins today while supporting more advanced applications over time. Shortlist 2-3 options suited to current and future needs. Then, pilot proof of concepts before deciding on platform investments.
Here is a table comparing popular data analytics tools:
Prioritizing Analytical Talent Development
Platforms only go so far without the analytical talent to utilize them. A skill shortage represents the #1 adoption barrier industry-wide.
Audit your current analytics headcount, experience levels, and functional distribution. Gauge skills gaps relative to use case requirements in sales, marketing, operations, and beyond.
Explore partnerships, contracted support, and managed services to supplement areas lacking depth. But also cultivate internal capabilities to sustain analytics excellence over the long term.
Formal training programs and rotational assignments are great for broadening analytical acumen across the employee base.
Additionally, incentivize continuous skills development through conferences, certifications, hackathons, and other upskilling initiatives.
With the right foundations of people, platforms, and executive backing, your team can reap the immense advantages detailed throughout this guide.
Conclusion
Data analytics has clearly become an indispensable tool for business success in the modern digital era. As this guide has shown, analytics unlocks immense potential in terms of efficiency gains, revenue growth, innovation, and strategic advantage.
Key takeaways for leaders include:
- Analytics delivers proven ROI across functions when focused on high-impact use cases.
- The right talent and platforms establish a foundation for quick wins and long-term excellence.
- Sustained commitment from executives enables analytics programs to mature and compound gains over time.
- With the exponential growth in data, analytics mastery is mandatory to remain competitive operationally and strategically.
Companies that embed an analytics culture and data-driven decision-making throughout their DNA will thrive. While chasing insights can feel overwhelming initially, the iterative journey promises a game-changing upside at each stage.
Leaders can drive rapid adoption by educating teams on analytics concepts, prioritizing key investments, and celebrating small wins. The result will be smarter businesses that learn faster, pivot quicker, and outexecute rivals who fail to leverage data just as effectively. The time to start is now.


